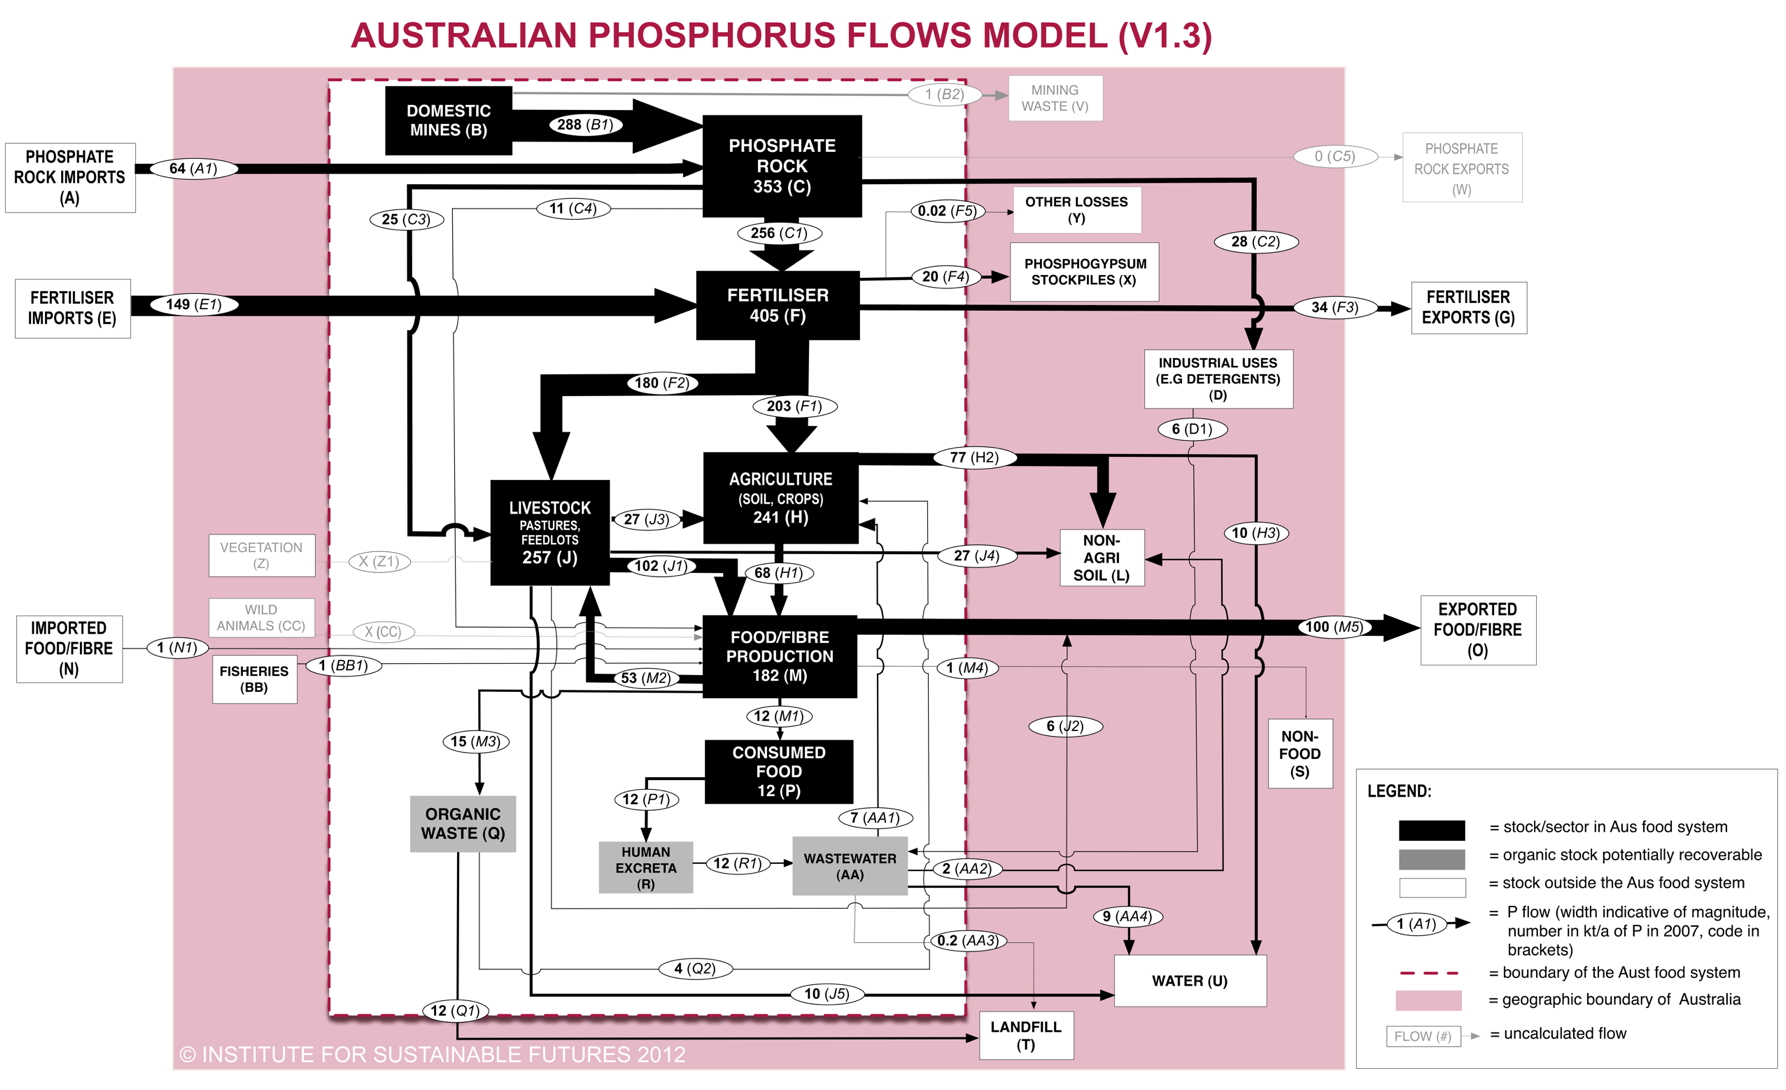
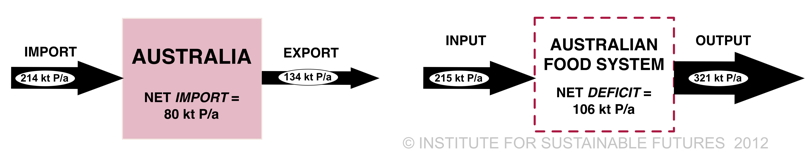
 The Australian Phosphorus Flows Model v1.3 indicates the major phosphorus inputs, outputs and internal flows of phosphorus through the Australian food system for the year 2007. The Australian food system is far from sustainable with respect to phosphorus. Despite being a net food exporter — feeding approximately 60-70 million people — Australia is a netimporter of phosphorus, with a net of 80 kt P imported into the country each year. Approximately 214 kt P/a is imported into the country via imported fertilisers and phosphate rock, while approximately 134 kt P/a is exported via fertiliser and food exports.
At the same time, Australia has a net phosphorus deficiency from the food system of approximately 106 kt P each year (see figure). While the productivity of the Australian food system is heavily dependent on substantial phosphorus inputs (215 kt P/a) in the form of phosphate rock and phosphate fertiliser imports, even larger phosphorus outputs (321 kt P/a) leave the Australian food system in the form of: fertilisers, agricultural exports (mainly wheat, beef and live animal exports) and losses to the environment (mainly non-agricultural soil, water and landfill). The largest phosphorus-demanding sectors are the livestock sector (via fertilised pastures and feed associated with dairy and beef cattle and broilers) and the agricultural export sector.
The food system is also highly inefficient with respect to phosphorus: losses are apparent in all sectors, and as high as 75% of P lost in the organic waste sector. In absolute terms (kt P/a) the greatest losses occur in the form of permanent losses from agriculture and livestock transported via soil and manure respectively, and the temporary loss in phosphogypsum stockpiles associated with fertiliser production.
Recovery rates of phosphorus also vary from sector to sector, with the greatest recycling of phosphorus for productive reuse in agriculture occurring in the livestock sector (40%) via manure reuse.
This analysis is important in identifying intervention points in the system that would increase the resilience, efficiency and ‘closed-loop’ nature of the food system. It also enables individual sectors and associated stakeholders to assess the key sources and fate of phosphorus within their sector for sector-specific responses.
The individual numbers should be taken with some degree of caution due to low data quality. Data was particularly poor or absent in the case of: P in mining waste, phosphate rock production and reserves on Christmas Island; changes in %P in fertilisers applied to crop versus pasture systems; %P lost from pastures as crop systems; P inputs into aquaculture; P in manure which is reused productively in agriculture; P content of live animals; P content of abattoir waste and the proportion that is recycled as blood and bone fertiliser.
Phosphorus ‘stocks’ (that is, P accumulated within sectors over time) were not calculated in Phase 1 due to lack of access to sufficient time-series data. While the fertiliser, food production and wastewater sectors are likely to have negligible stocks, other sectors will have significant stocks. For example, mining sector has a stock of phosphate rock reserves, which is currently being depleted at an annual rates of 352 kt P/a; the agricultural sector has a soil stock, currently accumulating at a rate of 77 kt P annually; and the livestock sector has an accumulation of P in manure, currently at a rate of 635 kt P each year.
While the year 2007 was select as the static model year due to highest data availability, there are drawbacks associated with using this reference year. For example, significant annual variations can occur, particularly within the fertiliser and agricultural sectors. 2007 was indeed a drought year for example. The model was structured so that a range of years (2006-2010) can ultimately be populated, however data was not available for all years to undertake this in Phase 1.
Phosphorus was modeled in terms of national averages, however in reality the Australian food system can also vary geospatially. For example, soil can have a phosphorus accumulation in some areas, and a deficit in other areas. Around 90% of the phosphorus associated with human excreta is concentrated in the wastewater system of coastal cities. This spatiality is also important in terms of logistics and energy required to transport phosphorus between sectors.
This project was supported by Rural Industries Research & Development Corporation (RIRDC) and the 2011 Mercedes-Benz BanksiaEnvironmental Research Award.
Resources:
Phase 1: Analysis of phosphorus flows through the Australian food production and consumption system, Australian Sustainable Phosphorus Futures, Cordell et al (2012) Institute for Sustainable Futures, prepared forRural Industries Research & Development Corporation. [available for download soon]
Securing a Sustainable Phosphorus Future for Australia, Cordell et al (2010), Farm Policy Journal.